Archive for the ‘Networks’ category

Making the Financial Networks Useful

June 14, 2009

Starting with the little spat between John Stewart and CNBC I started to think seriously about how the financial news stations are extremely broken. Now, I’ve mused on specific parts of this equation before. However, I’ve been writing this post, a more complete look, for a while. So, imagine my surprise when Barry Ritholtz beat me to the punch! Barry’s look, though, seems to focus more on the “low-hanging fruit” when it comes to improving CNBC. Personally, I think there is a massive overhaul needed. So, instead of taking the same approach as Barry (telling a network how to improve itself) I’ll focus on describing what my ideal financial news network would look like.

1. Make no buy/sell recommendations. Honestly, the shameless self-promoters that  go on CNBC are quite often wrong. There is no accountability for recommendations–obviously, the logistical issues are both important and daunting. However, there is a much larger problem that is most observable with Jim Cramer. I have no doubt Mr. Cramer is intelligent, just as I have no doubt that his show is useless drivel–he needs to make so many recommendations just to fill his airtime that no one ever sees his performance, CNBC doesn’t track it, and all the studies that look at his recommendations need to make huge assumptions. But, the easiest explanation of why recommendations are bad comes from a post entitled Lawyers vs. Detectives. Clearly, also, there doesn’t exist the air time or continuity to track and update recommendations correctly–the logisitical issues I mentioned earlier. And, to be frank, any idiot can just dump ticker symbols onto the screen and say a few sentences about why those ticker symbols are good or bad… and be completely wrong or stupid. The point of a good finance network should be to bring reporting and analysis to light. (Further evidence: look at Barron’s experts who, as a whole, underperform passive indices. And they are tracked and asked for analysis of their picks regularly.)

2. Emphasize investiagtive journalism. Financially literate, intelligent people can add a whole lot of value when it comes to explaining and digging into economic and financial stories. Think Kate Kelly and her three part tick tock of the Bear Stearns situation as a good example. Think of the deep look into the mortgage industry that NPR did. Think of the detailed profiles of various individuals at the center of the finance world. Clearly, there is a lot of value to be added merely by going beyond the puff piece. Right now what people get 90% of the time when it comes to finance reporting pertains to what the Dow Jones did or is doing for the day. Guess what? When stocks go up, it’s because there are more buyers than sellers. When they go down, vica versa. Trying to divine more than that from the market move on a given day is as useless and surface as it often is wrong.

3. Hire experts and not personalities. I’ll tell you a secret… Maria Bartiromo adds no value if you know anything about markets and finance to start with. I’ve seen her provide an outlet for executives to provide narrative versions of their press releases several times. There is never a question I’ve heard her ask that was probing or had an answer I didn’t already know from reading the NY Times or the WSJ. She doesn’t even understand journalism very well! The entire lineup of attractive and vacuous seat-warmers add no value. Remember this little episode with Fox Business news? Now, that’s a little different because it was live, breaking news. However, a thinking person probably would have stopped before talking about how great a move it was for Apple to buy AMD, despite the fact that such a purchase would have been “WTF?!” move for Apple–the current anchors just talk to talk. I even remember a CNBC anchor pulling up a guest’s chart on a segment (the network had been hyping this segment for a few hours–theoretically the anchor had prepared for it) and asked why, if things were so dire, the chart showed such a strong rally/uptrend. Well, the chart was showing spreads for a certain class of bonds–and, as we all know, when yield goes up, price goes down! She was anchoring a segment on fixed income (and had already been chatting about the topic for a few minutes!) and still couldn’t figure out what was going on in a very simple chart… Surely there’s room for improvement!

The model, though, for financial news anchors should really be an engaged, credentialed moderator. Thomas Keene, honestly, is a great example of this. I don’t catch his show (or podcast) as often as I would like, but whenever I do it’s clear he’s intelligent, familiar with the underlying issues, and that he views his job as getting his guests to make their case as well as expose the “other side” of the argument. A network should be able to create a lineup of intellectual experts (with relationships and enough personality to be interesting) in equity markets, corporate credit/finance, economics, macroeconomics, currencies, commodities, personal finance, etc. Networks haven’t seemed to figure out that, unlike human interest stories and traditional news, having some domain expertise is vital to being able to ask the right questions and get the underlying reasoning out into the open.

4. Go beyond soundbites and short on-air segments. I think finance is much more complicated than normal news, in the same way that political news usually is more complicated: there are lots of underlying dynamics, complex rules, and large parts of the process are hidden from view and established through precedent. Unlike a plane crash, terrorist attack, or story about some zany celebrity antic, financial news that focuses on the “what” instead of the “why” is dull, uninteresting, and useless. This is why financial news, in the first place, tries to explain what’s going on. So, it should only be natural that financial news, if it needs the “why” to be useful and is more complicated than garden-variety news, needs to allocate more than a few minutes to a given issue. No one is going to understand what’s going on with commercial real estate in five minutes. CDOs can’t even be explained in ten minutes, let alone covered in the context of the credit crisis in that time.

How can a financial news network, then, ensure that there is enough depth to a story or segment? Well, time is obviously a big piece of the equation. To revisit a prior example, Thomas Keene usually has guests on for 30+ minutes. However, media and a command of visual aides and interactive media online is also important. Some of the most compelling explanations of how CDOs work and different aspects of the credit crisis are graphics. Further, finance is based on data–models, data highlighted in charts and stories, and other material should all be made available online.

5. Embrace new media. As far as I can tell, no financial news station has a strong online presence. If a strong group of credentialed experts is the backbone of the network’s on-air talent (see #3 above) then they should have deeper, more valuable insights than what they can cover on the air. These thoughts should be blogged about, tweeted, and whatever else to make them as accessible as possible–more and more the “conversation” is online and to join it one must have their thoughts online. The NY Times does a good job at this–their columnists and reporters write all sorts of blog entries ranging from deep, researched pieces to random musings and clever one-line arguments.

Further, with my idealized network, all the content from on-air segments would be put on YouTube and made available to whomever wants to link or embed it. Openness and access would be key strategies for the network. A part of this is also making the on-air personalities and others who contribute regularly interact with the public as much as possible (currently, Twitter is a great medium for this).

6. Emphasize standards–make objectivity, fairness, and accountability the network’s core values. Barry talked about this in his list:

7.  Fact Check: An awful lot of things on air get stated with authority and confidence. Much of them are little more than junk or pop myths. Why is it that the more dubious a proposition is, the greater the confidence the speaker seems to muster? Consider fact checking as much of the statements that are made on air as possible, and making frequent corrections.

Now, this ties in with some of what I’ve said above. However, my point goes beyond this. Executives should not want to go one my idealized network when they need to “get out a statement”–the “narrative press release” as an interview is useless and doesn’t hold the subject of the interview accountable for their words. Similarly, when a guest comes on and makes an assertion that is incorrect it needs to be challenged at the time and corrected later–I clearly take a harder stance on this issue than Barry does. If people will be making their investment decisions based on information presented on the network and then they need to trust the network–viewers need to know the network strives to prove correct information and puts every effort into doing just that. Also, the rules of “journalistic engagement” for the network (things like policies on anonymous sourcing) should be public.

7. Make education a pillar of the network. Finance and markets, as I describe in multiples places above, are complicated and often counter-intuitive–a fair amount is “inside baseball.” Having a section of the website and some on-air time dedicated to explaining both terms and important but obscure facts and market dynamics is an important service. Simple things, like bond math, are important and static–these concepts (that subtly undergird all other topics–remember the anecdote about the misread chart above) should be revisited whenever absolutely necessary while being available at all times.

If these simple pieces were all followed, I believe there would exist a simple to follow, engaging financial network that would add a ton of value where there currently is a void. Then, maybe, the other networks would need to follow suit. I won’t hold my breath.
Notes and Predictions: The Stress Test

May 6, 2009

As the results of the stress test start leaking out slowly, it’s a fun exercise to make some educated guesses/predictions about what the future holds and take note of pertinent facts. As we’ve discussed before, there is a lot to take issue with when considering the results of the stress test at all, especially given the added layers of uncertainty stemming form the limited information provided in the scenarios. So, without further delay, let’s get started.

1. The baseline scenario will prove wholly inadequate as a “stress test.” Please, follow along with me as I read from the methodology (pdf).  I’ll start with the most egregious and reckless component of the mis-named baseline scenario (I would rename it the, “if payer works” scenario) : what I will refer to as “the dreaded footnote six.” From the document:

As noted above, BHCs [(Bank Holding Companies, or the firms being stress tested)] with trading account assets exceeding $100 billion as of December 31, 2008 were asked to provide projections of trading related losses for the more adverse scenario, including losses from counterparty credit risk exposures, including potential counterparty defaults, and credit valuation adjustments taken against exposures to counterparties whose probability of default would be expected to increase in the adverse scenario.(6)

[…]

(6) Under the baseline scenario, BHCs were instructed to assume no further losses beyond current marks.

(Emphasis mine.)

Holy <expletive>! In what alternate/parallel/baby/branching universe is this indicative of anything at all? Assume no further losses beyond current marks? Why not assume everything returns to par? Oh, well, that actually was a pretty valid assumption for the baseline scenario. From the document:

New FASB guidance on fair value measurements and impairments was issued on April 9, 2009, after the commencement of the [stress test].  For the baseline scenario supervisors considered firms’ resubmissions that incorporated the new guidance.

(Emphasis mine.)

Thank goodness! I was worried that the “if prayer works” scenario might have some parts that were worth looking at. Thankfully, for troubled banks, I can skip this entire section. (Confidence: 99.9999%)

2. Trading losses will be significantly understated across all five institutions that will need to report them. First, only institutions with over $100 billion in trading assets were asked to stress their trading positions. Second, from the section on “Trading Portfolio Losses” from the document:

Losses in the trading portfolio were evaluated by applying market stress factors … based on the actual market movements that occurred over the stress horizon (June 30 to December 31, 2008).

(Emphasis mine.)

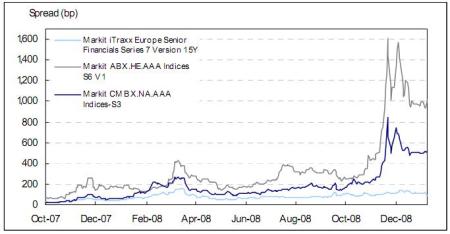
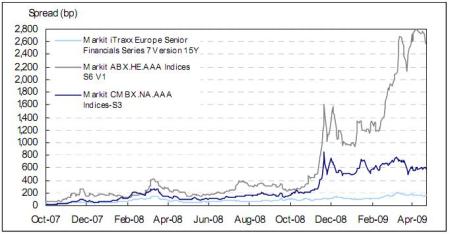
Okay, well, that seems reasonable, right? Hmmmm… Let’s take a look. Here is what some indicative spread movements for fixed income products looked like January 9th of 2009, according to Markit (who has made it nearly impossible to find historical data for their indices, so I’m resorting to cutting and pasting images directly–all images are from their site):

yearendgraph

(Click on the picture for a larger version.)

Well, looks like a big move is taken into account by using this time horizon. Clearly this should provide a reasonable benchmark for the stress test results, right? Well, maybe not.

currentgraph

(Click on the picture for a larger version.)

Yes, that’s right, we’ve undergone, for sub-prime securities a massive widening during 2009 already. Also, as far as I can tell, the tests are being run starting from the December 2008 balance sheet for each company. So, if I’m correct, for the harsher scenario, trading losses will be taken on December 2008 trading positions using December 2008 prices and applying June 2008 to December 2008 market movements. For sub-prime, it seems pretty clear that most securities would be written up (June 2008 Spread: ~200, December 2008 Spread: ~1000, Delta: ~800, Current Spread: ~2600, December 2008 to Today Delta: ~1600, Result: firms would take, from December 2008 levels, half the markdown they have already taken).

Also, it should be a shock to absolutely no one that most trading assets will undergo a lagged version of this same decline. Commercial mortgages and corporate securities rely on how firms actually perform. Consumer-facing firms, as unemployment rises, the economy worsens and consumption declines, and consumers default, will see a lagged deterioration that will appear in corporate defaults and small businesses shuttering–both of these will lead to commercial mortgages souring.  Indeed we’ve seen Moody’s benchmark report on commercial real estate register a massive deterioration in fundamentals. That doesn’t even take into account large, exogenous events in the sector. Likewise, we see consistently dire predictions in corporate credit research reports that only point to rising defaults 2009 and 2010.

In short, for all securities, it seems clear that using data from 2H2008 and applying those movements to December 2008 balance sheets should produce conservative, if not ridiculously understated loss assumptions. (Confidence: 90%)

3. Bank of America will have to go back to the government. This, likely, will be the end of Ken Lewis. It’s not at all clear that Bank of America even understands what’s going on. First, if I’m correctly reading Bank of America’s first quarter earnings information, the firm has around $69 billion in tangible common equity. Also, it should be noted that the FT is reporting that Bank of America has to raise nearly $34 billion.  Now, with all this in mind, let’s trace some totally nonsensical statements that, unlike any other examples in recent memory, were not attributed to anonymous sources (from the NYT article cited above):

The government has told Bank of America it needs $33.9 billion in capital to withstand any worsening of the economic downturn, according to an executive at the bank. […]

But J. Steele Alphin, the bank’s chief administrative officer, said Bank of America would have plenty of options to raise the capital on its own before it would have to convert any of the taxpayer money into common stock. […]

“We’re not happy about it because it’s still a big number,” Mr. Alphin said. “We think it should be a bit less at the end of the day.” […]

Regulators have told the banks that the common shares would bolster their “tangible common equity,” a measure of capital that places greater emphasis on the resources that a bank has at its disposal than the more traditional measure of “Tier 1” capital. […]

Mr. Alphin noted that the $34 billion figure is well below the $45 billion in capital that the government has already allocated to the bank, although he said the bank has plenty of options to raise the capital on its own.

“There are several ways to deal with this,” Mr. Alphin said. “The company is very healthy.”

Bank executives estimate that the company will generate $30 billion a year in income, once a normal environment returns. […]

Mr. Alphin said since the government figure is less than the $45 billion provided to Bank of America, the bank will now start looking at ways of repaying the $11 billion difference over time to the government.

(Emphasis mine.)

Right around the time you read the first bolded statement, you should have started to become dizzy and pass out. When you came to, you saw that the chief administrative officer, who I doubt was supposed to speak on this matter (especially in advance of the actual results), saying that a bank with $69 billion in capital would be refunding $11 billion of the $45 billion  in capital it has already received because they only need $34 billion in capital total. Huh? Nevermind that the Times should have caught this odd discrepancy, but if this is the P.R. face the bank wants to put on, they are screwed.

Now, trying to deal with what little substance there is in the article, along with the FT piece, it seems pretty clear that, if Bank of America needs $34 billion in additional capital, there is no way to get it without converting preferred shares to common shares. There is mention of raising $8 billion from a sale of a stake in the China Construction Bank (why are they selling things if they are net positive $11 billion, I don’t know). That leaves $26 billion. Well, I’m glad that “once a normal environment returns” Bank of America can generate $30 billion in income (Does all of that fall to T.C.E.? I doubt it, but I have no idea). However, over the past four quarters, Bank of America has added just $17 billion in capital… I will remind everyone that this timeframe spans both T.A.R.P. and an additional $45 billion in capital being injected into the flailing bank. Also, who is going to buy into a Bank of America equity offering now? Especially $26 billion of equity! If a troubled bank can raise this amount of equity in the current environment, then the credit crisis is over! Rejoice!

I just don’t see how Bank of America can fill this hole and not get the government to “bail it out” with a conversion. The fact that Bank of America argued the results of the test, frankly, bolsters this point of view. Further, this has been talked about as an event that requires a management change, hence my comment on Lewis.  (Confidence: 80% that the government has to convert to get Bank of America to “well capitalized” status)

Notes/Odds and Ends:

1. I have no idea what happened with the NY Times story about the results of the “Stress Test.” The WSJ and FT are on the same page, but there could be something subtle that I’m misunderstanding or not picking up correctly. Absent this, my comments stand. (Also, if might have been mean.unfair of me to pick on the content of that article.)

2. The next phases of the credit crisis are likely to stress bank balance sheets a lot more. The average bank doesn’t have huge trading books. However, they do have consumer-facing loan and credit products in addition to corporate loans and real estate exposure. In the coming months, we’ll see an increase in credit card delinquencies. Following that, we’ll see more consumer defaults and corporations’ bottom line being hurt from the declining fundamentals of the consumer balance sheet. This will cause corporate defaults. Corporate defaults and consumer defaults will cause commercial real estate to decline as well. The chain of events is just beginning. Which leads me to…

3. Banks will be stuck, unable to lend, for a long time. I owe John Hempton for this insight. In short, originations require capital. Capital, as we see, is in short supply and needed to cover losses for the foreseeable future. Hence, with a huge pipeline of losses developing and banks already in need of capital, there is likely not going to be any other lending going on for a while. This means banks’ ability to generate more revenue/earnings is going to be severely handicapped as sour loans make up a larger and larger percentage of their portfolios.

4. From what I’ve read, it seems that the actual Citi number, for capital to be raised, is between $6 billion and $10 billion. This puts their capital needs at $15 billion to $19 billion, since they are selling assets to raise around $9 billion, which is counted when considering the amount of capital that needs to be raised (according to various news stories). Interestingly, this is 44% to 55% of Bank of America’s needed capital. This paints a very different picture of the relative health of these two firms than the “common wisdom” does. Granted, this includes a partial conversion of Citi’s preferred equity to common equity.

5. I see a huge correlation between under-performing portfolios and a bank trying to negotiate it’s required capital lower by “appealing” the stress test’s assessment of likely losses in both the baseline and adverse scenarios. As I’ve talked about before, not all portfolio performance is created equal. Citi has seen an increasing (and accelerating) trend in delinquencies while JP Morgan has seen it’s portfolio stabilize. So, for the less-healthy banks to argue their losses are overstated by regulators, they are doubly wrong. It’ll be interesting to see how this plays out–for example, if JP Morgan’s credit card portfolio assumes better or worse performance than Citi and Bank of America.

Guest Post at Clusterstock

April 23, 2009

Hey, I wanted to let you, my loyal readers, know that I guest posted over at Clusterstock. The post, entitled “Investment Bank Scorecard” is my take on this past quarter as a whole. I think it’s worth clicking over and taking a look. I’d sum it up here, but, in all honesty, the value is in the nuances and small insights more than the general thesis.

Also, here is the chart attached to that post, in its orginal form.

Citi’s Earnings: Even Cittier Than You Think

April 20, 2009

Well, Citi reported earnings this past week. And, as many of you know, there are a few reasons you’ve heard to be skeptical that this was any sort of good news. However, there are a few reasons you probably haven’t heard… (oh, and my past issues on poor disclosure are just as annoying here)

On Revenue Generation: First, here are some numbers from Citi’s earnings report and presentation, Goldman’s earnings report, and JP Morgan’s earnings report:

Revenues from 1Q09 Earnings Reports

These numbers should bother Citi shareholders. Ignoring the 1Q08 numbers, Citi–whose global business is much larger and much more diverse than it’s rivals–generates no more, if not slightly less, revenue than the domestically focused JP Morgan and much, much less than Goldman. But it gets worse. Goldman’s balance sheet was $925 billion vs. Citi’s $1.06 trillion in assets within it’s investment banking businesses, roughly 10% larger.  I’d compare JP Morgan, but they provide a shamefully small amount of information. As an entire franchise, however, Citi was able to generate their headline number: $24.8 billion in revenue, on assets of $1.822 trillion. JP Morgan, as a whole, was able to generate $26.9 billion, on assets of $2.079 trillion. JP Morgan, then is 14% larger, by assets, and generstes 8% higher revenue.

These numbers should be disconcerting to Citi, it’s no better at revenue generation than it’s rivals, despite having a larger business in higher growth, higher margin markets. Further, in an environment rife with opportunity (Goldman’s results support this view, and anecdotal support is strong), Citi was totally unable to leverage any aspect of it’s business to get standout results… and we’re only talking about revenue! Forget it’s cost issues, impairments and other charges as it disposes assets, etc.

On The Magical Disappearing Writedowns: Even more amazing is the lack of writedowns. However, this isn’t because there aren’t any. JP Morgan had writedowns of, approximately, $900 million (hard to tell, because they disclose little in the way of details). Goldman had approximately $2 billion in writedowns (half from mortgages). Citi topped these with $3.5 billion in writedowns on sub-prime alone (although they claim only $2.2 billion in writedowns, which seems inconsistent). But, that isn’t close to the whole story. Last quarter, in what I could find almost no commentary on during the last conference call and almost nothing written about in filings or press releases, Citi moved $64 billion in assets from the “Available-for-sale and non-marketable equity securities” line item to the “Held-to-maturity” line item. In fact, $10.6 billion of the $12.5 billion in Alt-A mortgage exposure is in these, non–mark-to-market accounts. There was only $500 million in writedowns on this entire portfolio, surprise! Oh, and the non–mark-to-market accounts carry prices that are 11 points higher (58% of face versus 47% of face). What other crap is hiding from the light? $16.1 billion out of $16.2 billion total in S.I.V. exposure, $5.6 billion out of $8.5 billion total in Auction Rate Securities exposure, $8.4 billion out of $9.5 billion total in “Highly Leveraged Finance Commitments,” and, seemingly, $25.8 billion out of $36.1 billion in commercial real estate (hard to tell because their numbers aren’t clear), are all sitting in accounts that are no longer subject to writedowns based on fluctuations in market value, unlike their competitors. These are mostly assets managed off the trading desk, but marked according to different rules than traded assets. If one doesn’t have to mark their assets, then having no writedowns makes sense.

On The Not-so-friendly Trend: This is a situation where, I believe, the graphs speak for themselves.

credittrendsconsumertrendsmortgagetrends

Do any of these graphs look like things have turned the corner? Honestly, these numbers don’t even look like they are decelerating! Compare this with the (relatively few) graphs provided by JP Morgan.

jpmsubprimetrendshomeequitytrendjpmprimemortgagetrend

These aren’t directly comparable, as the categories don’t correspond to one another, and JP Morgan uses the more conservative 30-day delinquent instead of Citi’s 90+-day delinquent numbers. However, JP Morgan’s portfolio’s performance seems to be leveling out and even improving (with the possible exception of “Prime Mortgages”). Clearly, the pictures being painted of the future are very different for these institutions.

On the Stuff You Know About: I’ll be honest, this business about Citi benefiting from it’s own credit deterioration was confusing. Specifically, there is more going on when Citi refers to “credit value adjustments” than just profiting from it’s own Cittieness. However, Heidi Moore, of Deal Journal fame helped set me straight on this–the other things going on are dwarfed by the benefit I just mentioned. Here’s the relevant graphic from the earnings presentation:

cva-graphic

And, via Seeking Alpha’s Transcript, the comments from Ned Kelly that accompanied this slide:

Slide five is a chart similar to one that we showed last quarter which shows the movement in corporate credit spreads since the end of 2007. During the quarter our bond spreads widened and we recorded $180 million net gain on the value of our own debt for which we’ve elected the fair value option. On our non-monoline derivative positions counterparty CDS spreads actually narrowed slightly which created a small gain on a derivative asset positions.

Our own CDS spreads widened significantly which created substantial gain on our derivative liability positions. This resulted in a $2.7 billion net mark to market gain. We’ve shown on the slide the five-year bond spreads for illustrative purposes. CVA on our own fair value debt is calculated by weighting the spread movements of the various bond tenors corresponding to the average tenors of debt maturities in our debt portfolio. The debt portfolio for which we’ve elected the fair value options is more heavily weighted towards shorter tenures.

Notice that Citi’s debt showed a small gain, but it’s derivatives saw a large gain (the additional $166 million in gains related to derivatives was due to the credit of it’s counterparties improving). Why is this? Well, notice the huge jump in Citi’s CDS spread over this time period versus cash bonds, which were relatively unchanged. Now, from Citi’s 2008 10-K:

CVA Methodology

SFAS 157 requires that Citi’s own credit risk be considered in determining the market value of any Citi liability carried at fair value. These liabilities include derivative instruments as well as debt and other liabilities for which the fair-value option was elected. The credit valuation adjustment (CVA) is recognized on the balance sheet as a reduction in the associated liability to arrive at the fair value (carrying value) of the liability.

Citi has historically used its credit spreads observed in the credit default swap (CDS) market to estimate the market value of these liabilities. Beginning in September 2008, Citi’s CDS spread and credit spreads observed in the bond market (cash spreads) diverged from each other and from their historical relationship. For example, the three-year CDS spread narrowed from 315 basis points (bps) on September 30, 2008, to 202 bps on December 31, 2008, while the three-year cash spread widened from 430 bps to 490 bps over the same time period. Due to the persistence and significance of this divergence during the fourth quarter, management determined that such a pattern may not be temporary and that using cash spreads would be more relevant to the valuation of debt instruments (whether issued as liabilities or purchased as assets). Therefore, Citi changed its method of estimating the market value of liabilities for which the fair-value option was elected to incorporate Citi’s cash spreads. (CDS spreads continue to be used to calculate the CVA for derivative positions, as described on page 92.) This change in estimation methodology resulted in a $2.5 billion pretax gain recognized in earnings in the fourth quarter of 2008.

The CVA recognized on fair-value option debt instruments was $5,446 million and $888 million as of December 31, 2008 and 2007, respectively. The pretax gain recognized due to changes in the CVA balance was $4,558 million and $888 million for 2008 and 2007, respectively.

The table below summarizes the CVA for fair-value option debt instruments, determined under each methodology as of December 31, 2008 and 2007, and the pretax gain that would have been recognized in the year then ended had each methodology been used consistently during 2008 and 2007 (in millions of dollars).

cvatable

Got all that? So, Citi, in it’s infinite wisdom, decided to change methodologies and monetize, immediately, an additional 290 bps in widening on it’s own debt. This change saw an increase in earnings of $2.5 billion prior to this quarter.  In fact, Citi saw a total of $4.5 billion in earnings from this trick in 2008. However, this widening in debt spreads was a calendar year 2008 phenomenon, and CDS lagged, hence the out-sized gain this quarter in derivatives due to FAS 157 versus debt. Amazing.

And, while we’re here, I want to dispel a myth. This accounting trick has nothing to do with reality. The claim has always been that a firm could purchase it’s debt securities at a discount and profit from that under the accounting rules, so this was a form of mark-to-market. Well, unfortunately, rating agencies view that as a technical default–S&P even has a credit rating (“SD” for selective default) for this situation. This raises your cost of borrowing (what’s to say I’ll get paid in full on future debt?) and has large credit implications. I’m very, very sure that lots of legal documents refer to collateral posting, and other negative effects if Citi is deemed in “default” by a rating agency, and this would be a form of default. This is a trick, plain and simple–in reality, distressed tender offers would cost a firm money.

The Bottom Line: Citi isn’t out of the woods. In this recent earnings report I see a lot of reasons to both worry and remain pessimistic about Citi in the near- and medium-term. If you disagree, drop me a line… I’m curious to hear from Citi defenders.

How to Fix the Compensation Issue… Yesterday!

April 15, 2009

With all the tone-deafness that followed the great compensation debate of 2009, I have a very simple solution. The problem, despite what people commonly believe, is not the absolute level of compensation. No, it’s the fact that management’s personal incentives and employees’ incentives are aligned–shareholders are still in the wilderness. How many times have we heard the trite, absolutely silly refrain stating “we need to pay the valuable people that know where the bodies are buried so they can dispose of them!”? Way too many. Although, there are dozens of examples of retention bonuses being paid to people as they resign… Idiots.

So, what do I suggest? Add all compensation, beyond a base limit, say $250,000, as T.A.R.P. debt to institutions who have already received funds under the program–and the interest rate from this new debt should be very high. I would suggest… okay, I never merely suggest… I would demand (better!) that this new debt carry a high coupon. Maybe even ensure the interest owed is cutely linked to the way these publicly owned (partially, anyway) institutions are negatively impacting our economy. One example: this new debt could carry an interest rate equal to the greater of the (a) median of the top quartile of credit card interest rates issued by the company in question and (b) 24.99%.

Now, what does this do? It better aligns management and shareholders. How can a C.E.O. allow divisions that lost billions to run up it’s debt? And, how can an institution award these bonuses necessary to pay people, right out of taxpayer money, if they aren’t willing to pay it back later? By definition, every dollar that flows into the pockets of employees can’t go back to the taxpayers whose money saved these same institutions. Once managers need to actually justify why they are paying people, due to the higher cost, I guarantee fewer employees will receive these higher bonuses. Gone will be the cuspy performers who are being paid because Wall St. is a creature of habit. This will create a wholesale re-thinking of compensation at many institutions. And, honestly, it’s long overdue. To be honest, I don’t really view this higher cost as excessive, either. People being paid 8-12% of profits (it’s actually revenue traders are compensated on, but don’t tell anyone that) should wind up actually costing 10%-20% of profits with this excess debt, perhaps as high as 30%–but these employees continue to be employed and able to profit due to taxpayer funds to begin with. It’s time managers are required justify, to their boards and owners, why high compensation for various employees is necessary. And, since companies say a surtax or banning of bonuses is bad and bonuses are absolutely required, they should be more than willing to pay these higher rates–they need these people after all!

Contrarian View: HR 1586 (T.A.R.P. Surtax Bill) will Create Millionaires

March 19, 2009

This is  just a  few quick thoughts, but I believe, in a few years, we’ll be able to take this bill and place it’s effects high on the list of unintended consequences. Let’s wonder what a reasonable firm would do in order to protect it’s people as much as possible from this legislation… I would put forth the proposal that a firm would give it’s employees the most “bang for the buck.” This seems to clearly be by paying in options. Now, I don’t know all the technical details behind how finance companies have to account for and value options given as compensation, but, using the CBOE option pricer and volatility from Morningstar, I get around $0.50 as the option price for a strike of $2.50 at the time Citi was giving bonuses out, around the time it was at $1.00. Or, if we use $2.50 for the equity price and the strike price, we get $1.62 option price.

Since those prices are per share for lots of 100 option, we get anywhere between 500,000 and 155,000 options, depending on when Citi’s rules would require it to re-cast it’s payments to employees. That’s obviously a huge range. However, for some context, when Citi was trading at $50 / share, having 500,000 shares would have meant you had $25 million in the bank. And 155,000 shares would have meant you had $7.75 million in the bank. However, let’s look at some more likely scenarios. Citi is currently trading at $3.00. As these options are longer dated (I believe the prices quoted above were for 3 year options), could one see a world where Citi is at $10, $15, or even $20 3 years in the future? I think so. So, 155,000 options would be worth between $1.55 million and $3.1 million.The other option is some combination of cash and restricted stock. As we see above, the total shares one would get, if merely receiving restricted stock (at the current trading level) is approximately half to two-thirds.

Now, obviously there are risks. Citi might not be around in three or more years–that is anyone’s guess! This assumes share price increases quite a bit (although the numbers look good even for more modest scenarios). However, all of these would be issues with restricted shares as well–which Wall St. heavily relies upon for compensation. Also, this is just for Citi, which is clearly in a more precarious position than some of it’s peers. For a firm like Goldman, Morgan Stanley, or even Merrill/BofA, the probability of defaulting is way lower. And, for those firms, volatility is lower, making options less valuable, and increasing the ratio of options to restricted shares. the purposes of comparison, Goldman is currently trading at approximately $100 and it’s two year volatility is around 60%. This yields an option price of around $39, or 3x as many options as restricted shares. So, for every $20 Goldman’s shares go up, one would make 3x as much if they had options.

You see where I’m going with this? Now, I don’t know the specific rules surrounding a firm’s ability to re-cast their payments once they’ve been made, or how they compute strike prices, restricted share award prices, or other details. But, I would bet that these firms go back to their employees and let them re-think some of their options (no pun intended).

Fun Super Irony Fact: HR 1586, in the 110th congress was the “The Death Tax Repeal Act of 2007”!!!

Why Stress Test Really Means Guesswork

March 15, 2009

Well, we’ve heard a ton about stress tests recently. Want some details on what a stress test entails? The Journal has some details about the tests here. Now, as much as I think GDP and unemployment are fine things to project forward for economists, let’s walk through the way one would use this to actually price an asset. Let’s start with something simple, like a 10-year treasury note (note that treasury bond specifically refers to bonds with a 30-year maturity). Here are all the components one would need to stress test the value of a treasury note.

  1. Characteristics of the note itself: coupon, payment dates, maturity dates, etc.
  2. What the yield curve would look like at the date you’re pricing the note.

Why would one need to know the shape of the yield curve (term structure of rates)? This is important, in order to “PV” the bond’s cashflows most accurately, one would discount each cashflow by it’s risk–the simplest proxy is to discount each cash flow by the rate of interest one would need to pay to issue a bond maturing on that date. For the government, this rate of interest is the point on the treasury yield curve (actually, the par zero curve) with the same maturity date. An example would be, if I were going to price a cash payment I will receive in two years, and the government can currently issue two-year debt at 5%, I should discount my cash payment (also from the government, since it’s a treasury note) at 5%. Treasuries are the simplest of all instruments to value.

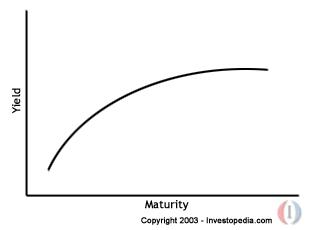
Here’s an example, form the link above, of what a treasury yield curve might look like:

Normal Yield Curve

Now, it is completely and totally guesswork to figure out, given unemployment and GDP figures, what the yield curve will look like at any date in the future. Indeed, one can plug these projections into a model and it can come up with a statistical guess… But the only thing we know for sure about that guess is that it won’t be accurate, although it might be close. However, things like inflation will drive the longer end of the yield curve and monetary policy will drive the shorter end, so these certainly aren’t directly taken from the stress test parameters, but would need to be a guess based on those parameters. This is a large source of uncertainty in pricing even these instruments in the stress test.

Next, let’s examine a corporate bond. What would we need for a corporate bond?

  1. Characteristics of the bond: coupon, payment dates, maturity dates, special features (coupon steps, sinking funds, call schedules, etc.), where in the capital structure this bond sits, etc.
  2. What the yield curve would look like at the date you’re pricing the bond.
  3. The spreads that the corporation’s debt will carry at the date you’re pricing the bond.

Oh no. We already saw the issues with #2, but now we have #3. What will this corporations credit spread (interest/yield required in excess of the risk free rate) at the time of pricing? Will the corporations debt, which could trade at a spread of anywhere from 5 to 1500 basis points, be lower? higher? Will the corporations spread curve be flatter? steeper?

Here is a good illustration of what I’m referring to (from the same source as the figure above):

Credit Spread

There, the spread is the difference between the purple line and the black line. As you can see, it’s different for different maturity corporate bonds (which makes sense, because if a company defaults in year two, it’ll also default on it’s three year debt.. but the companies’ two year debt might never default, but the company might default during it’s third year, creating more risk for three year bonds issued by that company than two year bonds). It shouldn’t be a surprise, after our exercise above, to learn that the best way to compute the price of a corporate bond is to discount each cashflow by it’s risk (in my example above, regardless of whether the company defaults in year two or year three, the interest payments from both the three year and two year debt that are paid in one year have the same risk).

Well, how does one predict the structure of credit spreads in the future? Here’s a hint: models. Interest rates, however, are an input to this model, since the cost of a firm’s borrowing is an important input to figuring out a corporation’s cashflow and, by extension, creditworthiness. So now we have not only a flawed interest rate projection, but we have a projection of corporate risk that, in addition to being flawed itself, takes our other flawed projections as an input! Understanding model error yet? Oh, and yes unemployment and the health of the economy will be inputs to the model that spits out our guess for credit spreads in the future as well.

Next stop on the crazy train, mortgage products! What does one need to project prices for mortgage products?

  1. Characteristics of the bond: coupon, payment dates, maturity dates, structure of the underlying securitization (how does cash get assigned in the event of a default, prepayment, etc.), etc.
  2. What the yield curve would look like at the date you’re pricing the bond.
  3. The spreads that the debt will carry at the date you’re pricing the bond.
  4. What prepayments will have occurred by the date you’re pricing the bond and what prepayments will occur in the future, including when each will occur.
  5. What defaults will have occurred by the date you’re pricing the bond and what defaults will occur in the future, including when each will occur.

Oh crap. We’ve covered #1-3. But, look at #4 and #5 … To price a mortgage bond, one needs to be able to project out, over the life of the bond, prepayments and defaults. Each is driven bydifferent variables and each happens in different timeframes. Guess how each projection is arrived at? Models! What are the inputs to these models? Well, interest rates (ones ability to refinance depends on where rates are at the time) over a long period of time (keep in mind that you need rates over time, having rates at 5% in three years is completely different if rates where 1% or 15% for the three years before). General economic health, including regional (or more local) unemployment rates (if the south has a spike in unemployment, but the rest of the country sees a slight decrease, you’ll likely see defaults increase). And a myrid of other variables can be tossed in for good measure. So now we have two more models, driven by our flawed interest rate projections, flawed credit projections (ones ability to refinance is driven by their mortgage rate, which is some benchmark interest rate [treasuries here] plus some spread, from #3), and the unemployment and GDP projections.

I will, at this point, decline to talk about pricing C.D.O.’s … Just understand, however, that C.D.O.’s are portfolios of corporate and mortgage bonds, so they are a full extra order of magnitude more complex. Is it clear, now, why these stress tests, as they seem to be defined, aren’t all that specific, and potentially not all that useful?

How to Fix the Crisis in Six Easy Steps

February 26, 2009

There is a lot of chatter about different plans, market anticipations, and pitfalls when it comes to “fixing” the economy and, specifically, nationalization. Despite the fact that I don’t have the same reach as several uneducated members of the media, I figured I’d share what I think the way forward is, regardless.

Step 1: Nationalize Citi and Bank of America. Let’s be honest, with recent talks of expanded stakes, ringfenced assets, and no end of the losses in sight, it’s probably time the U.S. Government came to grips with the fact that they already own the losses and the positive impact of letting shareholders keep the upside is nonsensical. Further, these institutions will need more money for a long time to come. And, if you’re paying attention, you know that the markets seem to twist and turn with the news coming out of financial institutions. Nationalization rumors depress the markets, talks of further government action scare away new capital, and the fundamental health of these firms makes current investors run.

Step 2: Begin lending. With so much chatter and anger about institutions not lending, it almost makes me wonder why there is such a deep lack of understanding. These sick institutions are trying to shrink their balance sheets and have a ton of souring assets on them. They have to raise capital to support their current asset base, so why do we really expect these banks and other firms to lend? Some would claim that lending for the sake of lending got us into this mess, but they are either telling only part of the story or don’t get it–excessive leverage and poor risk management got us to this point. In fact, I suspect that defaults on even the riskiest loans would be much lower if bank capital was free enough to continue making mortgage loans based on normal requirements for returns and risk/reward.

So, how do we begin lending? Simple, start a government bank. Well, not exactly, but the government now owns Fannie, Freddie, AIG, Citi, and BofA (see step 1). Clearly the government now (by step 2) has the infrastructure and technical know-how to manage the logisitical issues of setting up and running a lending platform. Now the government can lend directly and not wait for sick banks to do it. Further, they can underwrite to fairly normal lending standards and get a premium return on their capital. Also, rather than poaching the nationalized entitites’ “talent,” the government cam employ many out of work finance workers throughout the country (after all, lending in Missouri should probably be done by people in Missouri).

Step 3: Begin replenishing bank assets with new, cleaner assets. With all of these souring assets on the books of banks, their capital base being eroded, and leverage decreasing, TARP capital is probably being deployed very inefficiently and, obviously, conservatively. Well, since step 2 involves lending and creating assets, the government should then implement an auction process–all assets the government creates would then be auctioned off, much like treasury bonds are, to banks. Since the government would be lending based on normal underwriting standards (as compared to the previous paradigm of loan underwriting), these assets would have a strong credit profile and will likely perform much better than legacy assets. JP Morgan, for example, should jump at the chance to generate higher levels of retained earnings by buying assets when the rates it needs to pay are at historically low levels, once its capital frees up. This solves the chicken-and-egg problem of curing sick banks, hurting from consumer defaults and depressed economic activity, to free up the credit markets and getting economic activity to increase despite a lack of credit.

One could easily permute this plan in many ways. One possible way is to offer to swap new assets for legacy assets at current market levels to facilitate a much more immediate strengthening of the banks’ balance sheets. Another variation could include some partial government guarentee on assets it originates. I’m sure there are thousands more ways one could add bells and whistles.

Step 4: Broaden the Fannie and Freddie loan modifications and housing stabilization plan to the government’s new properties. I suppose this should be some sort of addendum to step 1, but it’s important enough to require some emphasis on it’s own. With Citi and Bank of America being so large, I’m sure the housing stabilization plan will have a much broader reach once those are wards of the state. We’ve all heard the arguments for stopping foreclosures and refinancing borrowers… When the house next door is foreclosed upon, your house loses tens of thousands of dollar in value, increases housing supply, etc.

Step 5: Break up the institutions that are owned by the government. Markets have been clamoring for Citi to be broken up for years. Bank of America shareholders probably want Merrill to be broken off A.S.A.P. (ditto for Countrywide). Chew up these mammoth institutions and spit out pieces that, in the future, could fail because they aren’t too big. This should be done to AIG, Citi, Bank of America, and both Fannie and Freddie.

Step 6: Immediately implement a new regulatory regime. This is pretty much a “common sense measure.” President Obama has begun to call for this, and it’s pretty clear that with no more major investment banks around, the S.E.C.’s role needs to be re-defined. I’ve already laid out my thoughts on what this new structure should look like.

Between all of these steps, we should have the tainted institutions out of the system, credit will start to free up, banks asset base will become more reliable, and systemic risks will go down as we significantly decrease the number of firms that are “too big to fail.” Seems logical to me…

All the Important Stories Without the Word “Commode” in Them

January 27, 2009

We learned a lot today, although tomorrow we might find that we learned completely different things. Here are the articles that prove the idiom, “When it rains it pours.”

1. Citi, in what can only be described as a series of epic P.R. fails, purchased a $50 million jet. Next in the series was this paragraph from DealBook:

A Citigroup spokesperson told DealBook that he could not confirm the reports that the bank was set to take control of a new jet, citing “security” concerns. “Executives are encouraged to fly commercial whenever possible to reduce expenses,” Citi said in a statement.

Seriously? Security concerns? Now, there are some rumblings that the jet was purchased two years ago. However, if there was ever a time to wage the P.R. war and risk getting sued to keep the big picture impression of your firm together, this was it. I can, without a doubt, say that if I were sitting in Vikram’s seat I would be refusing to pay for the jet or take delivery of it, and would be doing whatever I could to be sued. The headline, “Citi Sued for Failing to Honor Commitment to Purchase Corporate Jet” sounds like music compared to “Citigroup Likely to Face Criticism Over Jet” (the actual DealBook headline).

And in the end, they ceded the ground anyway.

2. Congratulations, you’ve hired some lobbyists! It turns out that a whole bunch of firms, including Citi, American Express, Capital One, Goldman Sachs, KeyCorp, Morgan Stanley, PNC and Bank of New York Mellon, all hired lobbyists. The whole notion of a company hiring a lobbyist, clearly, leads to obvious questions about companies representing their own interests and those of their shareholders instead of those of the people (who, now, are also their shareholders). I can’t possibly imagine what firms are thinking when they hire these lobbyists, except that they will “get away with it.” Absolutely ridiculous.

And, no sooner than I had noted this, newly confirmed Treasury Secretary Geithner cracks down on lobbying.

3. Apparently, Bank of America approved everything they used against John Thain when it came time to push him out. From the Elusive January 23rd version of the WSJ article:

Thain also left for a vacation in Vail, Colo., after the losses came to light, accelerated bonus payments at Merrill so they could be collected before the end of the year and scheduled a trip this week to attend the World Economic Forum in Davos, Switzerland […]

Vitriol between the Bank of America and Merrill camps also stemmed from the fact that Merrill had paid out bonuses much earlier than expected. A person familiar with Merrill’s bonus scheme said executives typically are told what their bonus will be by the second week of January and the payments are made in the second half of the month. Some people inside Bank of America believe Merrill accelerated the payouts to avoid having them cut amid a much-leaner plan at Bank of America.

(Emphasis mine.)

And, from the FT:

Ken Lewis, BofA’s embattled chief executive, ousted Mr Thain on Thursday after news of the bonus payments appeared in the Financial Times. BofA told the FT last week that Mr Thain had made the decision to pay bonuses in December instead of January and it had been “informed” of the move. The bank said Merrill was an independent company until the deal closed on January 1.

[…]

BofA yesterday confirmed there were conversations about the bonus payments prior to the pay-outs: “We never said we didn’t talk with them about it. But, in the end, it was their decision and they informed us of it.”

(Emphasis mine.)

Jeeze. Ken Lewis needs to go… His P.R. war to keep his job despite fleecing taxpayers is pathetic.

TARP Performance: Way Too Early to Judge

January 18, 2009

Felix has a post focused on some of the numbers in the CBO report on TARP. Specifically, it looks at subsidy rates (amount lost from various “bailouts” due to mark-to-market as a percentage of the original investment). First, I’ll note my strong objections to using mark-to-market at any given point in time as a true measure of what something has “cost” taxpayers. One issue that permeates this crisis is the government officials managing their response to (and this is borrowed from somewhere, but I simply cannot remember from where or find it) have something released before the asian markets open. Mark to market, however, is definitely the easiest to measure, hence the use of it. Things like economic activity, bank lending, credit rates for banks, etc. should be used as measures of TARP effectiveness.

Now, let’s move on to my other point–this is like calling the winner in the first few minutes of a game. Any analysis of the effectiveness of the bailouts is likely to be a bit skewed since what would have happened without them isn’t truly known. But drawing any conclusion on a five year investment less than three months after it was made is especially premature. The probability of taxpayers’  investments seeing an actual loss is, actually, quite low in my estimation. Why? These institutions were bailed out already, and that is, in some sense, an endorsement of not letting them fail in the near future. Be dismantled? Perhaps. Be sold? Possibly. But die, like Lehman did? Certainly not. In fact, if Bank of America and Citi prove anything, it’s that politicians are more likely to buy back into the game than face the taxpayers and explain how they lost tens of billions of dollars backing the wrong horse. Don’t get me wrong, I think there significant holes in the strategy for TARP.

This situation, of course, defines moral hazard when the current management is allowed to stay. Citi management can go around doing whatever they want to fix Citi, if they fail we pay. If they win, they look good. Same for Bank of America… Ken Lewis decides to acquire Merrill in a shotgun wedding and then plays chicken to get a subsidy. Did they lower the price of the Merrill acquisition? No. As a matter of fact, the government didn’t just have a right to put their boot on the professional throat of Ken Lewis, but they had a responsibility to–Mr. Lewis actually showed an active interest in leveraging the financial crisis and government strategy. But, I digress.

The point is we won’t know how our investments perform for quite some time, and if the strategy the government employs remains constant then taxpayers are unlikely to lose a dime. So, you won’t find me with a real-time accounting of the TARP investments in Bloomberg anytime soon.