Posted tagged ‘capital markets’

Revisiting a Debate We Should be Past

June 10, 2009

Recently, Felix Salmon, Clusterstock, and others have been mentioning an essay from the Hoover Institute about the financial crisis. Now, I haven’t yet linked to the essay in question… I will, but only after I’ve said some thing about it.

I was on the front lines of the securitization boom. I saw everything that happened and am intimately familiar with how one particular bank, and more generally familiar with many banks’, approach to these businesses. I think that there are no words that adequately describes how utterly stupid it is that there is still a “debate” going on surrounding banks and their roles in the financial crisis. There are no unknowns. People have been blogging, writing, and talking about what happened ad naseum. It’s part of the public record. Whomever the author of this essay is (I’m sure I’ll be berated for not knowing him like I was for not knowing Santelli — a complete idiot who has no place in a public conversation whose requisites are either truth or the least amount of intellectual heft), unless it’s writing was an excesses in theoretical reasoning about a parallel universe, it’s a sure sign they don’t what they are talking about that they make some of the points in the essay. Let’s start taking it apart so we can all get on with our day.

For instance, it isn’t true that Wall Street made these mortgage securities just to dump them on them the proverbial greater fool, or that the disaster was wrought by Wall Street firms irresponsibly selling investment products they knew or should have known were destined to blow up. On the contrary, Merrill Lynch retained a great portion of the subprime mortgage securities for its own portfolio (it ended up selling some to a hedge fund for 22 cents on the dollar). Citigroup retained vast holdings in its so-called structured investment vehicles. Holdings of these securities, in funds in which their own employees personally participated, brought down Bear Stearns and Lehman Brothers. AIG, once one of the world’s most admired corporations, made perhaps the biggest bet of all, writing insurance contracts against the potential default of these products.

So Wall Street can hardly be accused of failing to eat its own dog food. It did not peddle to others an investment product that it was unwilling to consume in vast quantities itself.

(Emphasis mine.)

Initial premise fail. I had a hard time finding the part to emphasize since it’s all so utterly and completely wrong. Since I saw everything firsthand, let me be unequivocal about my remarks: the entire point of the securitization business was to sell risk. I challenge anyone to find an employee of a bank who says otherwise. This claim, that “it isn’t true that Wall Street made these mortgage securities just to dump them on them the proverbial greater fool” is proven totally false. There’s a reason the biggest losers in this past downturn were the biggest winners in the “league tables” for years running. As a matter of fact, there’s a reason that league tables, and not some other measure, were a yardstick for success in the first place! League tables track transaction volume–do I really need to point out that one doesn’t  judge themselves by transaction volume when their goal isn’t to merely sell/transact?

In fact, the magnitude of writedowns by the very firms mentioned (Merrill and Citi) relative to the original value of these investments imply that a vast, vast majority of the holdings were or were derived from the more shoddily underwritten mortgages underwritten in late 2006, 2007, and early 2008. In fact, looking at ABX trading levels, as of yesterday’s closing, shows the relative quality of these mortgages and makes my point. AAA’s from 2007 (series 1 and 2) trading for 25-26 cents on the dollar and AAA’s from early 2006 trading at roughly 67 cents on the dollar. The relative levels are what’s important. Why would Merrill be selling it’s product for 22 cents on the dollar if the market level is so much higher (obviously the sale occurred a few months ago, but the “zip code” is still the same)? This is a great piece of evidence that banks are merely left holding the crap they couldn’t sell when the music stopped.

Now, onto the next stop on the “How wrong can you get it?” tour.

It isn’t true, either, that Wall Street manufactured these securities as a purblind bet that home prices only go up. The securitizations had been explicitly designed with the prospect of large numbers of defaults in mind — hence the engineering of subordinate tranches designed to protect the senior tranches from those defaults that occurred.

Completely incorrect. Several people who were very senior in these businesses told me that the worst case scenario we would ever see was, perhaps, home prices being flat for a few years. I never, not once, saw anyone run any scenarios with home price depreciation. Now, this being subprime, it was always assumed that individuals refinancing during the lowest interest rate period would start to default when both (a) rates were higher and (b) their interest rates reset. [Aside: Take note that this implicitly shows that people running these businesses knew that people were taking out loans they couldn’t afford.] Note that the creation of subordinate tranches, which were cut to exactly match certain ratings categories, was to (1) fuel the CDO market with product (obviously CDO’s were driven by the underlying’s ratings and were model based), (2) allow AAA buyers, including Fannie and Freddie, an excuse to buy bonds (safety!), and (3) maximize the economics of the execution/sale/securitization. If there were any reasons for tranches to be created, it had absolutely nothing to do with home prices or defaults.

Further, I would claim that there wasn’t even this level of detail applied to any analysis. We’ve seen the levels of model error that are introduced when one tries to be scientific about predictions. As I was told  many times, “If we did business based on what the models tell us we’d do no business.” Being a quant, this always made me nervous. In retrospect, I’m glad my instincts were so attuned to reality.

As a matter of fact, most of the effort wasn’t on figuring out how to make money if things go bad or protect against downside risks, but rather most time and energy was spent reverse engineering other firm’s assumptions. Senior people would always say to me, “Look, we have to do trades to make money. We buy product and sell it off–there’s a market for securities and we buy loans based on those levels–at market levels.” These statements alone show how singularly minded these executives (I hate that term for senior people) and businesses were. The litmus test for doing risky deals wasn’t ever “Would we own these?” it was “Can we sell all the risk?”

But wait, there’s more…

Nor is it plausible that all concerned were simply mesmerized by, or cynically exploitive of, the willingness of rating agencies to stamp Triple-A on these securities. Wall Street firms knew what the underlying dog food consisted of, regardless of what rating was stamped on it. As noted, they willingly bet their firm’s money on it, and their own personal money on it, in addition to selling it to outsiders.

One needs the “willingly bet [their own] money on it” part to be true to make this argument. I know exactly what people would say, “We provide a service. We aggregate loans, create bonds, get those bonds rated, and sell them at the levels the market dictates. It isn’t our place to decide if our customers are making a good or bad investment decision.” I know it’s redundant with a lot of the points above, but that’s life–the underlying principles show up everywhere. And, honestly, it’s the perfect defense for, “How did you ever think this made sense?”

And, the last annoying bit I read and take issue with…

Nor is it true that Wall Street executives and CEOs had insufficient “skin in the game,” so that “perverse” compensation incentives created the mess. That story also does not pan out. Individuals, it’s true, were paid sizeable bonuses in the years in which the securities were created and sold.

[…]

Richard Fuld, of failed Lehman Brothers, saw his net worth reduced by at least a hundred million dollars. James Cayne of Bear Stearns was reported to have lost nearly a billion dollars in a matter of a few months. AIG’s Hank Greenberg, who remained a giant shareholder despite being removed from the firm he built by New York Attorney General Eliot Spitzer in 2005, lost perhaps $2 billion. Thousands of lower-downs at these firms, those who worked in the mortgage securities departments and those who didn’t, also saw much wealth devastated by the subprime debacle and its aftermath.

Wow. Dick Fuld, who got $500 million, had his net worth reduced by $100 million? That’s your defense? And, to be honest, if you can’t gin up this discussion, then what can you gin up? The very nature of this debate is that all of these figures are unverifiable. James Cayne was reported to have lost nearly a billion dollars? Thanks, but what’s your evidence? The nature of rich people is that they hide their wealth, they diversify, and they skirt rules. So, sales of stock get fancy names like prepaid variable forwards. Show me their bank statements–even silly arguments need a tad of evidence, right?

Honestly, at this point I stopped reading. No point in going any further. So, now that you know how little regard for that which is already known and on the record this piece of fiction is, I’ll link to it…

Here ya go.

Although, Felix does a great job of taking this piece down too (links above)… Although, he’s a bit less combative in his tone.

Nor is it plausible that all concerned were simply mesmerized by, or cynically exploitive of, the willingness of rating agencies to stamp Triple-A on these securities. Wall Street firms knew what the underlying dog food consisted of, regardless of what rating was stamped on it.
Notes and Predictions: The Stress Test

May 6, 2009

As the results of the stress test start leaking out slowly, it’s a fun exercise to make some educated guesses/predictions about what the future holds and take note of pertinent facts. As we’ve discussed before, there is a lot to take issue with when considering the results of the stress test at all, especially given the added layers of uncertainty stemming form the limited information provided in the scenarios. So, without further delay, let’s get started.

1. The baseline scenario will prove wholly inadequate as a “stress test.” Please, follow along with me as I read from the methodology (pdf).  I’ll start with the most egregious and reckless component of the mis-named baseline scenario (I would rename it the, “if payer works” scenario) : what I will refer to as “the dreaded footnote six.” From the document:

As noted above, BHCs [(Bank Holding Companies, or the firms being stress tested)] with trading account assets exceeding $100 billion as of December 31, 2008 were asked to provide projections of trading related losses for the more adverse scenario, including losses from counterparty credit risk exposures, including potential counterparty defaults, and credit valuation adjustments taken against exposures to counterparties whose probability of default would be expected to increase in the adverse scenario.(6)

[…]

(6) Under the baseline scenario, BHCs were instructed to assume no further losses beyond current marks.

(Emphasis mine.)

Holy <expletive>! In what alternate/parallel/baby/branching universe is this indicative of anything at all? Assume no further losses beyond current marks? Why not assume everything returns to par? Oh, well, that actually was a pretty valid assumption for the baseline scenario. From the document:

New FASB guidance on fair value measurements and impairments was issued on April 9, 2009, after the commencement of the [stress test].  For the baseline scenario supervisors considered firms’ resubmissions that incorporated the new guidance.

(Emphasis mine.)

Thank goodness! I was worried that the “if prayer works” scenario might have some parts that were worth looking at. Thankfully, for troubled banks, I can skip this entire section. (Confidence: 99.9999%)

2. Trading losses will be significantly understated across all five institutions that will need to report them. First, only institutions with over $100 billion in trading assets were asked to stress their trading positions. Second, from the section on “Trading Portfolio Losses” from the document:

Losses in the trading portfolio were evaluated by applying market stress factors … based on the actual market movements that occurred over the stress horizon (June 30 to December 31, 2008).

(Emphasis mine.)

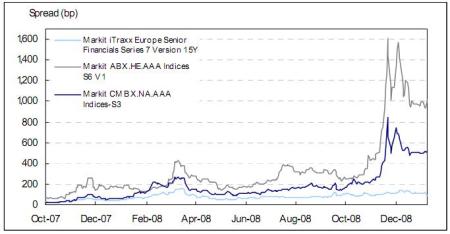
Okay, well, that seems reasonable, right? Hmmmm… Let’s take a look. Here is what some indicative spread movements for fixed income products looked like January 9th of 2009, according to Markit (who has made it nearly impossible to find historical data for their indices, so I’m resorting to cutting and pasting images directly–all images are from their site):

yearendgraph

(Click on the picture for a larger version.)

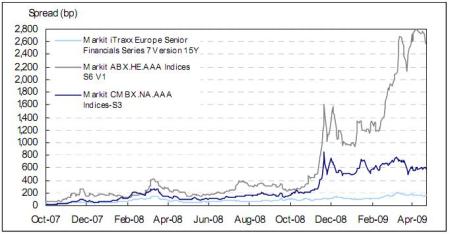
Well, looks like a big move is taken into account by using this time horizon. Clearly this should provide a reasonable benchmark for the stress test results, right? Well, maybe not.

currentgraph

(Click on the picture for a larger version.)

Yes, that’s right, we’ve undergone, for sub-prime securities a massive widening during 2009 already. Also, as far as I can tell, the tests are being run starting from the December 2008 balance sheet for each company. So, if I’m correct, for the harsher scenario, trading losses will be taken on December 2008 trading positions using December 2008 prices and applying June 2008 to December 2008 market movements. For sub-prime, it seems pretty clear that most securities would be written up (June 2008 Spread: ~200, December 2008 Spread: ~1000, Delta: ~800, Current Spread: ~2600, December 2008 to Today Delta: ~1600, Result: firms would take, from December 2008 levels, half the markdown they have already taken).

Also, it should be a shock to absolutely no one that most trading assets will undergo a lagged version of this same decline. Commercial mortgages and corporate securities rely on how firms actually perform. Consumer-facing firms, as unemployment rises, the economy worsens and consumption declines, and consumers default, will see a lagged deterioration that will appear in corporate defaults and small businesses shuttering–both of these will lead to commercial mortgages souring.  Indeed we’ve seen Moody’s benchmark report on commercial real estate register a massive deterioration in fundamentals. That doesn’t even take into account large, exogenous events in the sector. Likewise, we see consistently dire predictions in corporate credit research reports that only point to rising defaults 2009 and 2010.

In short, for all securities, it seems clear that using data from 2H2008 and applying those movements to December 2008 balance sheets should produce conservative, if not ridiculously understated loss assumptions. (Confidence: 90%)

3. Bank of America will have to go back to the government. This, likely, will be the end of Ken Lewis. It’s not at all clear that Bank of America even understands what’s going on. First, if I’m correctly reading Bank of America’s first quarter earnings information, the firm has around $69 billion in tangible common equity. Also, it should be noted that the FT is reporting that Bank of America has to raise nearly $34 billion.  Now, with all this in mind, let’s trace some totally nonsensical statements that, unlike any other examples in recent memory, were not attributed to anonymous sources (from the NYT article cited above):

The government has told Bank of America it needs $33.9 billion in capital to withstand any worsening of the economic downturn, according to an executive at the bank. […]

But J. Steele Alphin, the bank’s chief administrative officer, said Bank of America would have plenty of options to raise the capital on its own before it would have to convert any of the taxpayer money into common stock. […]

“We’re not happy about it because it’s still a big number,” Mr. Alphin said. “We think it should be a bit less at the end of the day.” […]

Regulators have told the banks that the common shares would bolster their “tangible common equity,” a measure of capital that places greater emphasis on the resources that a bank has at its disposal than the more traditional measure of “Tier 1” capital. […]

Mr. Alphin noted that the $34 billion figure is well below the $45 billion in capital that the government has already allocated to the bank, although he said the bank has plenty of options to raise the capital on its own.

“There are several ways to deal with this,” Mr. Alphin said. “The company is very healthy.”

Bank executives estimate that the company will generate $30 billion a year in income, once a normal environment returns. […]

Mr. Alphin said since the government figure is less than the $45 billion provided to Bank of America, the bank will now start looking at ways of repaying the $11 billion difference over time to the government.

(Emphasis mine.)

Right around the time you read the first bolded statement, you should have started to become dizzy and pass out. When you came to, you saw that the chief administrative officer, who I doubt was supposed to speak on this matter (especially in advance of the actual results), saying that a bank with $69 billion in capital would be refunding $11 billion of the $45 billion  in capital it has already received because they only need $34 billion in capital total. Huh? Nevermind that the Times should have caught this odd discrepancy, but if this is the P.R. face the bank wants to put on, they are screwed.

Now, trying to deal with what little substance there is in the article, along with the FT piece, it seems pretty clear that, if Bank of America needs $34 billion in additional capital, there is no way to get it without converting preferred shares to common shares. There is mention of raising $8 billion from a sale of a stake in the China Construction Bank (why are they selling things if they are net positive $11 billion, I don’t know). That leaves $26 billion. Well, I’m glad that “once a normal environment returns” Bank of America can generate $30 billion in income (Does all of that fall to T.C.E.? I doubt it, but I have no idea). However, over the past four quarters, Bank of America has added just $17 billion in capital… I will remind everyone that this timeframe spans both T.A.R.P. and an additional $45 billion in capital being injected into the flailing bank. Also, who is going to buy into a Bank of America equity offering now? Especially $26 billion of equity! If a troubled bank can raise this amount of equity in the current environment, then the credit crisis is over! Rejoice!

I just don’t see how Bank of America can fill this hole and not get the government to “bail it out” with a conversion. The fact that Bank of America argued the results of the test, frankly, bolsters this point of view. Further, this has been talked about as an event that requires a management change, hence my comment on Lewis.  (Confidence: 80% that the government has to convert to get Bank of America to “well capitalized” status)

Notes/Odds and Ends:

1. I have no idea what happened with the NY Times story about the results of the “Stress Test.” The WSJ and FT are on the same page, but there could be something subtle that I’m misunderstanding or not picking up correctly. Absent this, my comments stand. (Also, if might have been mean.unfair of me to pick on the content of that article.)

2. The next phases of the credit crisis are likely to stress bank balance sheets a lot more. The average bank doesn’t have huge trading books. However, they do have consumer-facing loan and credit products in addition to corporate loans and real estate exposure. In the coming months, we’ll see an increase in credit card delinquencies. Following that, we’ll see more consumer defaults and corporations’ bottom line being hurt from the declining fundamentals of the consumer balance sheet. This will cause corporate defaults. Corporate defaults and consumer defaults will cause commercial real estate to decline as well. The chain of events is just beginning. Which leads me to…

3. Banks will be stuck, unable to lend, for a long time. I owe John Hempton for this insight. In short, originations require capital. Capital, as we see, is in short supply and needed to cover losses for the foreseeable future. Hence, with a huge pipeline of losses developing and banks already in need of capital, there is likely not going to be any other lending going on for a while. This means banks’ ability to generate more revenue/earnings is going to be severely handicapped as sour loans make up a larger and larger percentage of their portfolios.

4. From what I’ve read, it seems that the actual Citi number, for capital to be raised, is between $6 billion and $10 billion. This puts their capital needs at $15 billion to $19 billion, since they are selling assets to raise around $9 billion, which is counted when considering the amount of capital that needs to be raised (according to various news stories). Interestingly, this is 44% to 55% of Bank of America’s needed capital. This paints a very different picture of the relative health of these two firms than the “common wisdom” does. Granted, this includes a partial conversion of Citi’s preferred equity to common equity.

5. I see a huge correlation between under-performing portfolios and a bank trying to negotiate it’s required capital lower by “appealing” the stress test’s assessment of likely losses in both the baseline and adverse scenarios. As I’ve talked about before, not all portfolio performance is created equal. Citi has seen an increasing (and accelerating) trend in delinquencies while JP Morgan has seen it’s portfolio stabilize. So, for the less-healthy banks to argue their losses are overstated by regulators, they are doubly wrong. It’ll be interesting to see how this plays out–for example, if JP Morgan’s credit card portfolio assumes better or worse performance than Citi and Bank of America.

Citi’s Earnings: Even Cittier Than You Think

April 20, 2009

Well, Citi reported earnings this past week. And, as many of you know, there are a few reasons you’ve heard to be skeptical that this was any sort of good news. However, there are a few reasons you probably haven’t heard… (oh, and my past issues on poor disclosure are just as annoying here)

On Revenue Generation: First, here are some numbers from Citi’s earnings report and presentation, Goldman’s earnings report, and JP Morgan’s earnings report:

Revenues from 1Q09 Earnings Reports

These numbers should bother Citi shareholders. Ignoring the 1Q08 numbers, Citi–whose global business is much larger and much more diverse than it’s rivals–generates no more, if not slightly less, revenue than the domestically focused JP Morgan and much, much less than Goldman. But it gets worse. Goldman’s balance sheet was $925 billion vs. Citi’s $1.06 trillion in assets within it’s investment banking businesses, roughly 10% larger.  I’d compare JP Morgan, but they provide a shamefully small amount of information. As an entire franchise, however, Citi was able to generate their headline number: $24.8 billion in revenue, on assets of $1.822 trillion. JP Morgan, as a whole, was able to generate $26.9 billion, on assets of $2.079 trillion. JP Morgan, then is 14% larger, by assets, and generstes 8% higher revenue.

These numbers should be disconcerting to Citi, it’s no better at revenue generation than it’s rivals, despite having a larger business in higher growth, higher margin markets. Further, in an environment rife with opportunity (Goldman’s results support this view, and anecdotal support is strong), Citi was totally unable to leverage any aspect of it’s business to get standout results… and we’re only talking about revenue! Forget it’s cost issues, impairments and other charges as it disposes assets, etc.

On The Magical Disappearing Writedowns: Even more amazing is the lack of writedowns. However, this isn’t because there aren’t any. JP Morgan had writedowns of, approximately, $900 million (hard to tell, because they disclose little in the way of details). Goldman had approximately $2 billion in writedowns (half from mortgages). Citi topped these with $3.5 billion in writedowns on sub-prime alone (although they claim only $2.2 billion in writedowns, which seems inconsistent). But, that isn’t close to the whole story. Last quarter, in what I could find almost no commentary on during the last conference call and almost nothing written about in filings or press releases, Citi moved $64 billion in assets from the “Available-for-sale and non-marketable equity securities” line item to the “Held-to-maturity” line item. In fact, $10.6 billion of the $12.5 billion in Alt-A mortgage exposure is in these, non–mark-to-market accounts. There was only $500 million in writedowns on this entire portfolio, surprise! Oh, and the non–mark-to-market accounts carry prices that are 11 points higher (58% of face versus 47% of face). What other crap is hiding from the light? $16.1 billion out of $16.2 billion total in S.I.V. exposure, $5.6 billion out of $8.5 billion total in Auction Rate Securities exposure, $8.4 billion out of $9.5 billion total in “Highly Leveraged Finance Commitments,” and, seemingly, $25.8 billion out of $36.1 billion in commercial real estate (hard to tell because their numbers aren’t clear), are all sitting in accounts that are no longer subject to writedowns based on fluctuations in market value, unlike their competitors. These are mostly assets managed off the trading desk, but marked according to different rules than traded assets. If one doesn’t have to mark their assets, then having no writedowns makes sense.

On The Not-so-friendly Trend: This is a situation where, I believe, the graphs speak for themselves.

credittrendsconsumertrendsmortgagetrends

Do any of these graphs look like things have turned the corner? Honestly, these numbers don’t even look like they are decelerating! Compare this with the (relatively few) graphs provided by JP Morgan.

jpmsubprimetrendshomeequitytrendjpmprimemortgagetrend

These aren’t directly comparable, as the categories don’t correspond to one another, and JP Morgan uses the more conservative 30-day delinquent instead of Citi’s 90+-day delinquent numbers. However, JP Morgan’s portfolio’s performance seems to be leveling out and even improving (with the possible exception of “Prime Mortgages”). Clearly, the pictures being painted of the future are very different for these institutions.

On the Stuff You Know About: I’ll be honest, this business about Citi benefiting from it’s own credit deterioration was confusing. Specifically, there is more going on when Citi refers to “credit value adjustments” than just profiting from it’s own Cittieness. However, Heidi Moore, of Deal Journal fame helped set me straight on this–the other things going on are dwarfed by the benefit I just mentioned. Here’s the relevant graphic from the earnings presentation:

cva-graphic

And, via Seeking Alpha’s Transcript, the comments from Ned Kelly that accompanied this slide:

Slide five is a chart similar to one that we showed last quarter which shows the movement in corporate credit spreads since the end of 2007. During the quarter our bond spreads widened and we recorded $180 million net gain on the value of our own debt for which we’ve elected the fair value option. On our non-monoline derivative positions counterparty CDS spreads actually narrowed slightly which created a small gain on a derivative asset positions.

Our own CDS spreads widened significantly which created substantial gain on our derivative liability positions. This resulted in a $2.7 billion net mark to market gain. We’ve shown on the slide the five-year bond spreads for illustrative purposes. CVA on our own fair value debt is calculated by weighting the spread movements of the various bond tenors corresponding to the average tenors of debt maturities in our debt portfolio. The debt portfolio for which we’ve elected the fair value options is more heavily weighted towards shorter tenures.

Notice that Citi’s debt showed a small gain, but it’s derivatives saw a large gain (the additional $166 million in gains related to derivatives was due to the credit of it’s counterparties improving). Why is this? Well, notice the huge jump in Citi’s CDS spread over this time period versus cash bonds, which were relatively unchanged. Now, from Citi’s 2008 10-K:

CVA Methodology

SFAS 157 requires that Citi’s own credit risk be considered in determining the market value of any Citi liability carried at fair value. These liabilities include derivative instruments as well as debt and other liabilities for which the fair-value option was elected. The credit valuation adjustment (CVA) is recognized on the balance sheet as a reduction in the associated liability to arrive at the fair value (carrying value) of the liability.

Citi has historically used its credit spreads observed in the credit default swap (CDS) market to estimate the market value of these liabilities. Beginning in September 2008, Citi’s CDS spread and credit spreads observed in the bond market (cash spreads) diverged from each other and from their historical relationship. For example, the three-year CDS spread narrowed from 315 basis points (bps) on September 30, 2008, to 202 bps on December 31, 2008, while the three-year cash spread widened from 430 bps to 490 bps over the same time period. Due to the persistence and significance of this divergence during the fourth quarter, management determined that such a pattern may not be temporary and that using cash spreads would be more relevant to the valuation of debt instruments (whether issued as liabilities or purchased as assets). Therefore, Citi changed its method of estimating the market value of liabilities for which the fair-value option was elected to incorporate Citi’s cash spreads. (CDS spreads continue to be used to calculate the CVA for derivative positions, as described on page 92.) This change in estimation methodology resulted in a $2.5 billion pretax gain recognized in earnings in the fourth quarter of 2008.

The CVA recognized on fair-value option debt instruments was $5,446 million and $888 million as of December 31, 2008 and 2007, respectively. The pretax gain recognized due to changes in the CVA balance was $4,558 million and $888 million for 2008 and 2007, respectively.

The table below summarizes the CVA for fair-value option debt instruments, determined under each methodology as of December 31, 2008 and 2007, and the pretax gain that would have been recognized in the year then ended had each methodology been used consistently during 2008 and 2007 (in millions of dollars).

cvatable

Got all that? So, Citi, in it’s infinite wisdom, decided to change methodologies and monetize, immediately, an additional 290 bps in widening on it’s own debt. This change saw an increase in earnings of $2.5 billion prior to this quarter.  In fact, Citi saw a total of $4.5 billion in earnings from this trick in 2008. However, this widening in debt spreads was a calendar year 2008 phenomenon, and CDS lagged, hence the out-sized gain this quarter in derivatives due to FAS 157 versus debt. Amazing.

And, while we’re here, I want to dispel a myth. This accounting trick has nothing to do with reality. The claim has always been that a firm could purchase it’s debt securities at a discount and profit from that under the accounting rules, so this was a form of mark-to-market. Well, unfortunately, rating agencies view that as a technical default–S&P even has a credit rating (“SD” for selective default) for this situation. This raises your cost of borrowing (what’s to say I’ll get paid in full on future debt?) and has large credit implications. I’m very, very sure that lots of legal documents refer to collateral posting, and other negative effects if Citi is deemed in “default” by a rating agency, and this would be a form of default. This is a trick, plain and simple–in reality, distressed tender offers would cost a firm money.

The Bottom Line: Citi isn’t out of the woods. In this recent earnings report I see a lot of reasons to both worry and remain pessimistic about Citi in the near- and medium-term. If you disagree, drop me a line… I’m curious to hear from Citi defenders.

Why Stress Test Really Means Guesswork

March 15, 2009

Well, we’ve heard a ton about stress tests recently. Want some details on what a stress test entails? The Journal has some details about the tests here. Now, as much as I think GDP and unemployment are fine things to project forward for economists, let’s walk through the way one would use this to actually price an asset. Let’s start with something simple, like a 10-year treasury note (note that treasury bond specifically refers to bonds with a 30-year maturity). Here are all the components one would need to stress test the value of a treasury note.

  1. Characteristics of the note itself: coupon, payment dates, maturity dates, etc.
  2. What the yield curve would look like at the date you’re pricing the note.

Why would one need to know the shape of the yield curve (term structure of rates)? This is important, in order to “PV” the bond’s cashflows most accurately, one would discount each cashflow by it’s risk–the simplest proxy is to discount each cash flow by the rate of interest one would need to pay to issue a bond maturing on that date. For the government, this rate of interest is the point on the treasury yield curve (actually, the par zero curve) with the same maturity date. An example would be, if I were going to price a cash payment I will receive in two years, and the government can currently issue two-year debt at 5%, I should discount my cash payment (also from the government, since it’s a treasury note) at 5%. Treasuries are the simplest of all instruments to value.

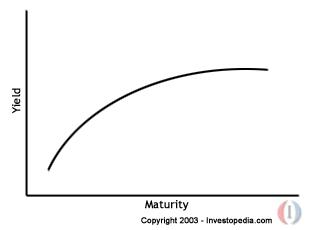
Here’s an example, form the link above, of what a treasury yield curve might look like:

Normal Yield Curve

Now, it is completely and totally guesswork to figure out, given unemployment and GDP figures, what the yield curve will look like at any date in the future. Indeed, one can plug these projections into a model and it can come up with a statistical guess… But the only thing we know for sure about that guess is that it won’t be accurate, although it might be close. However, things like inflation will drive the longer end of the yield curve and monetary policy will drive the shorter end, so these certainly aren’t directly taken from the stress test parameters, but would need to be a guess based on those parameters. This is a large source of uncertainty in pricing even these instruments in the stress test.

Next, let’s examine a corporate bond. What would we need for a corporate bond?

  1. Characteristics of the bond: coupon, payment dates, maturity dates, special features (coupon steps, sinking funds, call schedules, etc.), where in the capital structure this bond sits, etc.
  2. What the yield curve would look like at the date you’re pricing the bond.
  3. The spreads that the corporation’s debt will carry at the date you’re pricing the bond.

Oh no. We already saw the issues with #2, but now we have #3. What will this corporations credit spread (interest/yield required in excess of the risk free rate) at the time of pricing? Will the corporations debt, which could trade at a spread of anywhere from 5 to 1500 basis points, be lower? higher? Will the corporations spread curve be flatter? steeper?

Here is a good illustration of what I’m referring to (from the same source as the figure above):

Credit Spread

There, the spread is the difference between the purple line and the black line. As you can see, it’s different for different maturity corporate bonds (which makes sense, because if a company defaults in year two, it’ll also default on it’s three year debt.. but the companies’ two year debt might never default, but the company might default during it’s third year, creating more risk for three year bonds issued by that company than two year bonds). It shouldn’t be a surprise, after our exercise above, to learn that the best way to compute the price of a corporate bond is to discount each cashflow by it’s risk (in my example above, regardless of whether the company defaults in year two or year three, the interest payments from both the three year and two year debt that are paid in one year have the same risk).

Well, how does one predict the structure of credit spreads in the future? Here’s a hint: models. Interest rates, however, are an input to this model, since the cost of a firm’s borrowing is an important input to figuring out a corporation’s cashflow and, by extension, creditworthiness. So now we have not only a flawed interest rate projection, but we have a projection of corporate risk that, in addition to being flawed itself, takes our other flawed projections as an input! Understanding model error yet? Oh, and yes unemployment and the health of the economy will be inputs to the model that spits out our guess for credit spreads in the future as well.

Next stop on the crazy train, mortgage products! What does one need to project prices for mortgage products?

  1. Characteristics of the bond: coupon, payment dates, maturity dates, structure of the underlying securitization (how does cash get assigned in the event of a default, prepayment, etc.), etc.
  2. What the yield curve would look like at the date you’re pricing the bond.
  3. The spreads that the debt will carry at the date you’re pricing the bond.
  4. What prepayments will have occurred by the date you’re pricing the bond and what prepayments will occur in the future, including when each will occur.
  5. What defaults will have occurred by the date you’re pricing the bond and what defaults will occur in the future, including when each will occur.

Oh crap. We’ve covered #1-3. But, look at #4 and #5 … To price a mortgage bond, one needs to be able to project out, over the life of the bond, prepayments and defaults. Each is driven bydifferent variables and each happens in different timeframes. Guess how each projection is arrived at? Models! What are the inputs to these models? Well, interest rates (ones ability to refinance depends on where rates are at the time) over a long period of time (keep in mind that you need rates over time, having rates at 5% in three years is completely different if rates where 1% or 15% for the three years before). General economic health, including regional (or more local) unemployment rates (if the south has a spike in unemployment, but the rest of the country sees a slight decrease, you’ll likely see defaults increase). And a myrid of other variables can be tossed in for good measure. So now we have two more models, driven by our flawed interest rate projections, flawed credit projections (ones ability to refinance is driven by their mortgage rate, which is some benchmark interest rate [treasuries here] plus some spread, from #3), and the unemployment and GDP projections.

I will, at this point, decline to talk about pricing C.D.O.’s … Just understand, however, that C.D.O.’s are portfolios of corporate and mortgage bonds, so they are a full extra order of magnitude more complex. Is it clear, now, why these stress tests, as they seem to be defined, aren’t all that specific, and potentially not all that useful?

Rick Santelli is a Lesson for our Children

February 21, 2009

So, by now you’ve heard of the rant of some guy I’d never heard of before (not to be confused with Barron’s Michael Santoli). Does anyone else find it amusing that Mr. Santelli was ranting on the floor of an “open outcry” trading pit? That’s right, he was ranting about wasteful spending to help homeowners while standing on a monument to the past of finance and inefficient execution.

Mr. Santelli, while I completely accept the fact that you are most likely compensated based on how many viewers you reel in and your entertainment value, and certainly not based on the quality of your journalism (this is CNBC after all, the house of Cramer), analysis, or even grasp of reality, you should still, every now and again, try reading something. From the details of the plan one could learn some simple things:

1. The plan is available only to those people whose mortgages are owned by Fannie or Freddie or those whose mortgages were backed by Fannie and Freddie and put into securities by them. Fannie and Freddie have strict limits on whose mortgages can go into those pools. They have to have high FICO scores, relatively low LTVs, and there is a maximum size allowed. Please note that this restriction, in and of itself, totally disqualifies sub-prime mortgage loans. Let me repeat: sub-prime mortgages and agency-backed mortgages are a totally disjoint set of mortgage loans–there is no overlap.

2. The program does not reduce principal owed. So, in essence, there is no forgiveness of debt, but only a reduction in interest rates and, perhaps, an extending of the term of the loan to reduce monthly payments. People still owe the same amount as before. Sounds like a welfare state to me…

3. The program doesn’t allow refinancing of second homes or investment properties. So all the speculators that own 3 houses on that were supposed to be flipped cannot refinance any mortgages except for the single first mortgage on the house they currently reside in.

4. Second mortgages aren’t covered under the plan. All the people who took out HELOCs to borrow money to buy stocks aren’t going to be bailed out either.

5. There is about $75 billion being used to help stabilize the multi-trillion dollar mortgage market. This number alone implied that there is some selection process to weed out unworthy people from being given government funds.

Look, I want the economy to improve as much as the next guy, but I think swelling the unemployment rolls by one idiotic reporter might be the kind of change I can believe in. Oh, and let’s finally close down the value-destroying open-outcry trading pits. Maybe removing that friction in our economy can help us save a few dollars.

I was going to stop here, but I’ll be honest… the complete and total stupidity of Santelli and those knuckle dragging dinosaurs who still use hand motions to make money, add trnsaction costs, and keep the computers at bay (not all of them, but most of them, I’m sure) on the floor of the C.M.E. are the reason middle America hates everyone in finance. Further, it’s the reason we need a bailout. How often did I hear “not my problem” or “because that’s where the market is” or any number of other, totally tone-deaf incantations from the mouths of people making seven-digit bonuses? Often. And, to be honest, do we have even single piece of tape with Mr. Santelli yelling about taxpayers paying for Citi? Bank of America? How about AIG? No? Well, we gave Merrill Lynch $15 billion and around $4 billion of that was immediately blown through to mint 696 seven-digit bonuses.

At least I can take comfort in knowing that Mr. Santelli will be forgotten in 100 years and that his rant likely has no lasting impact on our society–it showcases the worst, most base and uninformed stupididty. Children, pay attention in school or you’ll wind up working on the CME trading floor for CNBC.

TARP Performance: Way Too Early to Judge

January 18, 2009

Felix has a post focused on some of the numbers in the CBO report on TARP. Specifically, it looks at subsidy rates (amount lost from various “bailouts” due to mark-to-market as a percentage of the original investment). First, I’ll note my strong objections to using mark-to-market at any given point in time as a true measure of what something has “cost” taxpayers. One issue that permeates this crisis is the government officials managing their response to (and this is borrowed from somewhere, but I simply cannot remember from where or find it) have something released before the asian markets open. Mark to market, however, is definitely the easiest to measure, hence the use of it. Things like economic activity, bank lending, credit rates for banks, etc. should be used as measures of TARP effectiveness.

Now, let’s move on to my other point–this is like calling the winner in the first few minutes of a game. Any analysis of the effectiveness of the bailouts is likely to be a bit skewed since what would have happened without them isn’t truly known. But drawing any conclusion on a five year investment less than three months after it was made is especially premature. The probability of taxpayers’  investments seeing an actual loss is, actually, quite low in my estimation. Why? These institutions were bailed out already, and that is, in some sense, an endorsement of not letting them fail in the near future. Be dismantled? Perhaps. Be sold? Possibly. But die, like Lehman did? Certainly not. In fact, if Bank of America and Citi prove anything, it’s that politicians are more likely to buy back into the game than face the taxpayers and explain how they lost tens of billions of dollars backing the wrong horse. Don’t get me wrong, I think there significant holes in the strategy for TARP.

This situation, of course, defines moral hazard when the current management is allowed to stay. Citi management can go around doing whatever they want to fix Citi, if they fail we pay. If they win, they look good. Same for Bank of America… Ken Lewis decides to acquire Merrill in a shotgun wedding and then plays chicken to get a subsidy. Did they lower the price of the Merrill acquisition? No. As a matter of fact, the government didn’t just have a right to put their boot on the professional throat of Ken Lewis, but they had a responsibility to–Mr. Lewis actually showed an active interest in leveraging the financial crisis and government strategy. But, I digress.

The point is we won’t know how our investments perform for quite some time, and if the strategy the government employs remains constant then taxpayers are unlikely to lose a dime. So, you won’t find me with a real-time accounting of the TARP investments in Bloomberg anytime soon.

Bear Stearns: Where We Are, Some Little Known Facts, and Opinions

March 21, 2008

Well, it looks like the dust has settled on the situation. My predictions have actually fared quite well–lawsuits, retention bonuses, brokers jumping ship, and some interesting rumblings about management seeking out new bidders.

Bloomberg even highlighted Jamie Dimon’s greenmail:

Dimon made the proposal to several hundred Bear Stearns senior managing directors at a meeting yesterday evening in the securities firm’s Manhattan headquarters, according to two people who attended. He said members of the group who are asked to stay after the acquisition is complete will get additional JPMorgan shares, according to the attendees, who asked not to be identified because the meeting was private.

Bear Stearns employees own about a third of its stock, with a large concentration in the hands of senior managing directors. Their support may help JPMorgan counter opposition from billionaire Joseph Lewis, who owns 8.4 percent of Bear Stearns and said yesterday he may seek an alternative to the bank’s proposed purchase.

“He’s basically bribing them for their votes,” said Richard Bove, an analyst at Punk Ziegel & Co., referring to Dimon’s presentation. “In this environment, there are no jobs on Wall Street, so he can bribe them by letting them keep their jobs and they’ll vote for him.”

Lots of people have opined on the merger terms and the possibilities for other bidders, and even some odd provisions that suggest no one knows the entire story yet. Everyone who reads my blog knows what I think on the obvious points. Here’s an interesting fact, too, that I haven’t seen elsewhere. From the Times Online:

A counter-offer for Bear Stearns would face a series of hurdles. Part of the JPMorgan Chase offer, which values Bear at $2 a share, includes the financial support of the Federal Reserve Bank of New York, which has underwritten $30 billion of the most toxic of Bear Stearns’s investments. The New York Fed also extended special financing to JPMorgan to cover the cost of Bear Stearns redundancies and impending litigation. Any new bidder would have to convince the central bank that it should transfer its underwriting to support a new offer.

(emphasis mine).

Wow. Talk about a sweet deal! I’m not sure what that sentence means, but I know I haven’t seen that anywhere else, so I remain skeptical, but it wouldn’t surprise me. So, with this heavy handed approach, here’s a question: Why does the Fed care so much about ensuring the specific deal they got JPM to ink goes through? In the above Deal Journal post, it’s made clear that the Fed wants this deal to go through. So, if there is another bidder out there, at a higher price, then why does it matter who gets Bear? Certainly the crisis they were talking about ha been avoided, no? Let’s examine the facts (from a myriad of sources):

  • Bear Stearns had gotten a 28 day loan, via JPM, from the Fed.
  • The Fed had decided toget Bear sold A.S.A.P., this left other bidders out, as reported by the media.
  • The Fed decided to guarantee, essentially, $30 billion in assets on Bear’s balance sheet.
  • The Fed has now decided to open up it’s discount window to securities firms, to avoid this situation in the future.

These actions seem inconsistent. Why would you force a securities firm to be bought, but then allow other to borrow at the discount window? Why would you make a 28 day loan, and then, with not much else changing, force another alternative? Why would you try to get JPM to accurately asses the value of Bear, and then, when they are unable to do so, both guarantee the most troublesome assets and allow JPM to lock in a very low bid price?

Now, I hate to be trite, but the taxpayers now own $30 billion dollars of stuff that is nearly impossible to value and, simultaneously, not going up in value (leaving only flat or down). JPM shareholders are getting roughly $1 billion in incremental earnings (I, obviously, would claim that when all is said and done that number will be lower, but that’s their number and we have no reason to believe that they don’t believe it to be accurate) for a fraction of the outlay in cash (and potentially not even the legal expenses, if indeed the above statement from The Times Online is true). And all the while, the Fed is standing guard over the gasping, bleeding body of Bear Stearns warding off further bidders? This isn’t the kind of intervention that I can honestly say sounds “above board.” To me, one either let’s Bear file for bankruptcy protection or they are bailed out–forcing a suitor onto them seems a bit weird.

Now begins the next chapter in this saga, exploring who profited from the demise of Bear and the source of the rumors that caused this whole mess.

Good News or Bad News First? (And Some Bear Links)

March 19, 2008

The good, for continuity. I spent about an hour chatting over IM with Felix Salmon and Equity Private (with a quick guest appearance by DealBreaker’s Bess Levin). It was quite an interesting time, to say the least!

The bad, now. They actually killed my post ideas. Yes, you heard me right, killed them dead. Well, it was a bit conspiratorial. I had conjectured that JPM’s option to purchase 20% of Bear at $2.00 and their “locking up” Bear’s building meant that they were happy to have someone else come in higher (earn the difference between the higher bid and $2 on 20% of Bear’s shares, and get the building). Alas, the fly in the ointment? Felix pointed out Section 6.9 of the merger agreement (Tidbit: Section 3.2 … “please provide”). I still believe that Bear’s advisory and Leveraged Finance business have value to, say, a P.E. buyer.

Well, even if it wasn’t likely, the markets must be assuming that a higher bid was likely, right? To that end, I had a post all ready! Bear closed at $5.91 today. If you assume that premium is due to a higher price, then there’s a 50/50 chance Bear get’s bought at $9.50 ($5.91 – $2.00 is approx 50% * ($9.50 – $2.00), essentially assuming the share price premium is a probability times a premium from a higher priced deal). I had all the numbers crunched. Alas, Felix has quashed that one too. I’m not 100% sure I buy the “debt holders are buying the stock” argument, but my other theories are all killed.

Unfortunately, then, I have no clever post. Although, here is one question answered.

Bear Stearns: Notes and Predictions

March 17, 2008

Wow. What a difference a day makes. Bear Stearns is now, apparently, being fire-sold for $2 a share to avoid being fire-sold for the values of it’s assets minus it’s liabilities.

I was reading the WSJ piece on the topic, and it seems like there was a lot of pressure applied by the Fed to ensure Bear got sold, with no regard for shareholders (the article states this, in essence). So counterparty risk is now secure. Great! But wouldn’t it have been better to run a real process and determine the value of the company? Wouldn’t it have been more valuable to not send the message that the “health of the financial markets” is more important than a firm’s sale occurring at their true equity value? (And aren’t both of those, taken together, a contradiction? Mis-valued assets was how this mess got started.)  So, let’s make some bold predictions! I don’t think they will all be right, but they are obviously all reasonable to me. I’ll show my hand and give the probability I ascribe to the prediction coming true, as well.

Prediction: Lots of shareholder lawsuits. K.K.R. was looking a bidding, so was J.C. Flowers, and the Fed says the deal needs to be done today, so they get crammed out. Who do you sue? Everybody of course! Hence JPM estimates $6b in costs for this transaction, first item listed–litigation. Probability: 100% (Bonus prediction: Someone notable from Bear joins in a lawsuit or files one themself! Probability: 50%)

Prediction: The price gets raised. A process wasn’t run, shareholders will demand more, and the Fed is taking $30 billion in risk. For $1 billion in accretion to earnings, and not even being in the first loss position on the toxic assets Bear is holding, why pay such a low price? This will become a problem for JPM. Keep in mind, this can be raised (the pruchase price) by having to pay out certain shareholders more than the bid price. For example, employees they wish to retain might have shares made whole at a higher level than the sale (you have 40k shares of BSC, you get $40 in JPM stock for each share if you stay, for example). Probability: 70%

Prediction: JPM will never see some of those assets add to their franchise. If the prime brokerage business really saw the kinds of outflows reported by the media (from Bear, that is) JPM could already be finding itself over-paying for that asset. And the mortgage and securitization business at Bear? Management for that business are at the top of that market in terms of knowledge and relationships–watch that business experience brain drain quickly. Probability: 70%

Prediction: Integration will be a nightmare. Culture clash will occur at many points in the process and within many businesses. JPM and Bear’s cultures aren’t compatible. Bear is a very raw environment and is very cut-throat. You’ll see this get ugly, fast. Big names on both sides will leave and power struggles will be common. Perhaps this is normal merger behavior, but it will be worse because the Bear employee have already been financially destroyed. You’ll see resentment for JPM from ex-Bear employees and silos form within the firm. It will be difficult to interact with certain parts of the firm depending on where you worked when JPM bought Bear. Ouch. Probability: 60%

Well, that’s it for now. I’m sure much more information will leak out as this deal develops. If this drags on or lots of game-changing information comes to light, I might revisit these later.

I hedged the “Hail Mary”

February 6, 2008

Just a thought,  but I wonder if it’s the case that improbable events in sports follow a similar distribution to deviant events in the capital markets. When one thinks about it, they have many of the same elements. Humans are making decisions clouded by the intensity of a situation and there is a feedback based on performance. Also, very unlikely events occur much more frequently than they should. Just a thought.